Books like The Best American Infographics 2013 by David Byrne


xvii, 165 p. : 25 cm
First publish date: 2013
Genre: Arts & Culture/Graphic Design
Authors: David Byrne
★ ★ ★ ★ ★ 2.0 (1 community ratings)

The Best American Infographics 2013 by David Byrne

How are these books recommended?

The books recommended for The Best American Infographics 2013 by David Byrne are shaped by reader interaction. Votes on how closely books relate, user ratings, and community comments all help refine these recommendations and highlight books readers genuinely find similar in theme, ideas, and overall reading experience.


Have you read any of these books?
Your votes, ratings, and comments help improve recommendations and make it easier for other readers to discover books they’ll enjoy.

Books similar to The Best American Infographics 2013 (8 similar books)
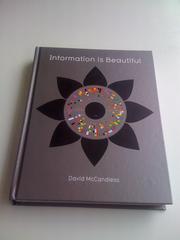
Information is Beautiful by 6916565|David McCandless book cover

πŸ“˜ Information is Beautiful

A visual guide that transforms complex data into striking illustrations, showing how information shapes our modern world.

β˜…β˜…β˜…β˜…β˜…β˜…β˜…β˜…β˜…β˜… 3.0 (3 ratings)
Similar? ✓ Yes 0 ✗ No 0
How Charts Lie by 11701589|Alberto Cairo book cover

πŸ“˜ How Charts Lie

**A leading data visualization expert explores the negative - and positive - influences that charts have on our perception of truth.** We’ve all heard that a picture is worth a thousand words, but what if we don’t understand what we’re looking at? Social media has made charts, infographics, and diagrams ubiquitous - and easier to share than ever. While such visualizations can better inform us, they can also deceive by displaying incomplete or inaccurate data, suggesting misleading patterns - or simply misinform us by being poorly designed, such as the confusing β€œeye of the storm” maps shown on TV every hurricane season. Many of us are ill equipped to interpret the visuals that politicians, journalists, advertisers, and even employers present each day, enabling bad actors to easily manipulate visuals to promote their own agendas. Public conversations are increasingly driven by numbers, and to make sense of them we must be able to decode and use visual information. By examining contemporary examples ranging from election-result infographics to global GDP maps and box-office record charts, *How Charts Lie* teaches us how to do just that.

β˜…β˜…β˜…β˜…β˜…β˜…β˜…β˜…β˜…β˜… 4.0 (1 rating)
Similar? ✓ Yes 0 ✗ No 0
The Best American Infographics 2015 by 11877266|Maria Popova book cover

πŸ“˜ The Best American Infographics 2015


β˜…β˜…β˜…β˜…β˜…β˜…β˜…β˜…β˜…β˜… 4.0 (1 rating)
Similar? ✓ Yes 0 ✗ No 0
Information Graphics by 11781544|Sandra Rendgen book cover

πŸ“˜ Information Graphics


β˜…β˜…β˜…β˜…β˜…β˜…β˜…β˜…β˜…β˜… 4.0 (1 rating)
Similar? ✓ Yes 0 ✗ No 0
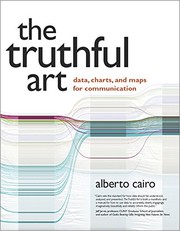
The Truthful Art by 11701589|Alberto Cairo book cover

πŸ“˜ The Truthful Art


β˜…β˜…β˜…β˜…β˜…β˜…β˜…β˜…β˜…β˜… 3.0 (1 rating)
Similar? ✓ Yes 0 ✗ No 0
Dear data by 11825524|Giorgia Lupi book cover

πŸ“˜ Dear data

Dear Data is an intimate, year‑long mail‑art project where Giorgia Lupi and Stefanie Posavec transform everyday momentsβ€”sleep, spending, mirror useβ€”into hand‑drawn visualizations on postcards, celebrating the beauty of small data and human detail.

β˜…β˜…β˜…β˜…β˜…β˜…β˜…β˜…β˜…β˜… 5.0 (1 rating)
Similar? ✓ Yes 0 ✗ No 0
HTML & Web artistry 2 by 6927614|Natalie Zee book cover

πŸ“˜ HTML & Web artistry 2


β˜…β˜…β˜…β˜…β˜…β˜…β˜…β˜…β˜…β˜… 0.0 (0 ratings)
Similar? ✓ Yes 0 ✗ No 0
CSS by 12662176|David McFarland book cover

πŸ“˜ CSS

An introductory guide to Cascading Style Sheets (CSS) that covers the basics and practical applications for designing and publishing modern web sites.

β˜…β˜…β˜…β˜…β˜…β˜…β˜…β˜…β˜…β˜… 0.0 (0 ratings)
Similar? ✓ Yes 0 ✗ No 0

Some Other Similar Books

The Visual Miscellaneum: A Colorful Guide to the World's Most Consequential Trivia by David McCandless
Data Points: Visualization That Means Something by Nathan Yau
Now You See It: Simple Visualization Techniques for Quantitative Data by Kirk W. St. Amant
Information Graphics: A Comprehensive Illustrated Reference by Robert L. Harris
The Power of Visual Thinking: Insights from Leading Experts on the Use of Visuals to Bring Clarity and Inspiration by George Piso, Annette T. Markham
Visualize This: The FlowingData Guide to Design, Visualization, and Statistics by Nathan Yau
Data Points: Visualization That Means Something by Nathan Yau
Information Graphics in Design by Giorgia Lupi and Stefanie Posavec

Have a similar book in mind? Let others know!

Please login to submit books!